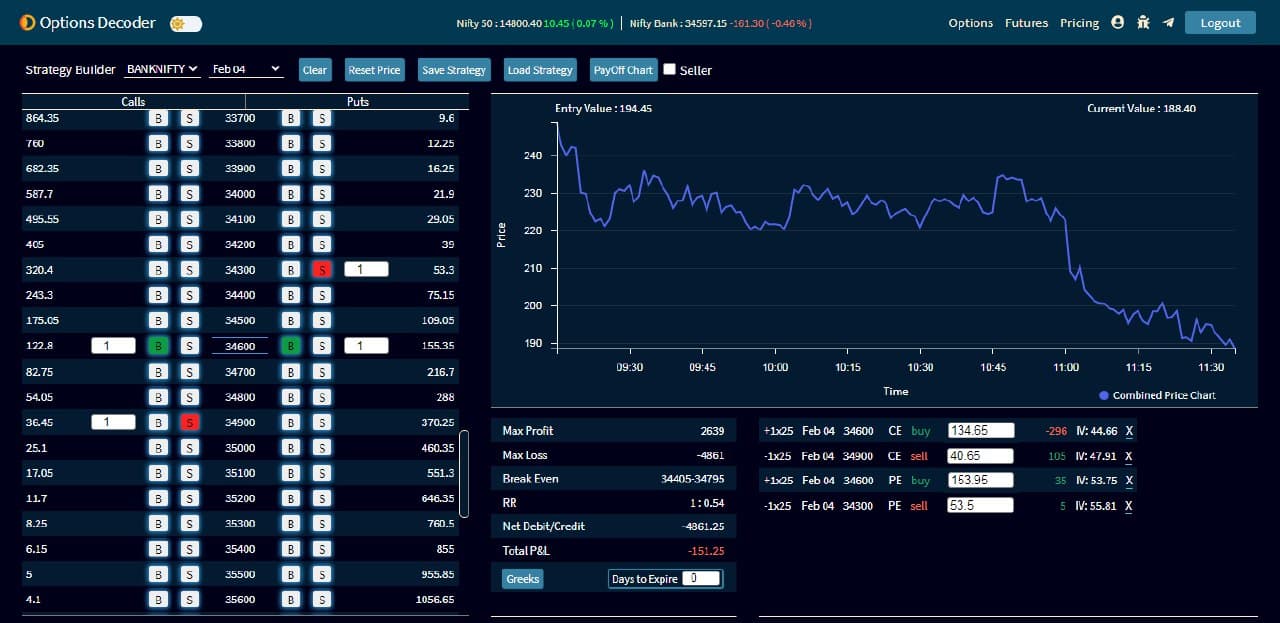
The combined price chart helps to track where your position is headed.
Here, all the Buy Strikes added and Sell Strikes are subtracted and plotted in a single line chart. (as default).
34600CE buy for 134.65
34900CE sell for 40.65
34600PE buy 153.95
34300PE sell 53.5
Then (134.65-40.65+153.95-53.5) = 194.45 is the entry value and from there you can track the position.
If you are a seller, select the Seller check box. Here, all the Buy Strikes are subtracted and Sell Strikes are added.

What does this check box of seller mean?
If the strategy is in a short position, then you can select the seller check box, so the chart will become easy to understand your position.
Like, when the line chart go down, you are in profit and if it goes up, your position is in loss.
Options Decoder Launch Offer: https://options-decoder.truedata.in/p...
Please follow our TrueData Options Decoder Telegram Channel: https://t.me/truedata_options_decoder to get information related to all new offers and new features.
TrueData Options Decoder Telegram Group (to discuss or to post any queries): https://t.me/truedata_options_decoder_group


