
Help deriving Buy/Sell side from WebSocket data
Hi Team,
I'm new to TrueData, transitioning from traditional broker platforms (such as Kite, which I’ve used with a ₹2000 monthly subscription). I’m really impressed with the reliability and consistency of your truedata_ws WebSocket feed — great work!
I primarily work on Orderflow-based algo trading strategies, and I often compare data with visualizations from platforms like Gocharting. I’ve found that your WebSocket data aligns well with what I see on those platforms — which is fantastic.
However, I’m trying to derive a few more fields and need your guidance.
From the TrueData WebSocket feed, I receive data in the following format (sample):
{
"timestamp": "2025-07-28T20:07:38",
"symbol_id": 950000072,
"symbol": "CRUDEOIL-I",
"ltp": 5787.0,
"ltq": 3.0,
"atp": 5750.2,
"ttq": 13211.0,
"day_open": 5671.0,
"day_high": 5819.0,
"day_low": 5657.0,
"prev_day_close": 5648.0,
"oi": 10546,
"prev_day_oi": 11510,
"turnover": 7596596000.0,
"special_tag": "",
"tick_seq": 3452,
"best_bid_price": 5785.0,
"best_bid_qty": 11,
"best_ask_price": 5787.0,
"best_ask_qty": 5,
"tick_type": 1
}
The issue I'm facing is — I’m trying to determine whether each tick (specifically using tick_seq) represents a Buy trade or Sell trade. In other words, I’d like to derive something like:
- Trade Side: Buy / Sell
- Buy Volume / Sell Volume
- Buy Trade Count / Sell Trade Count
Currently, I don’t see a side field or anything similar in the response. Is there any way to infer the trade direction from the data fields provided? Or do you provide any additional field that could help with this?
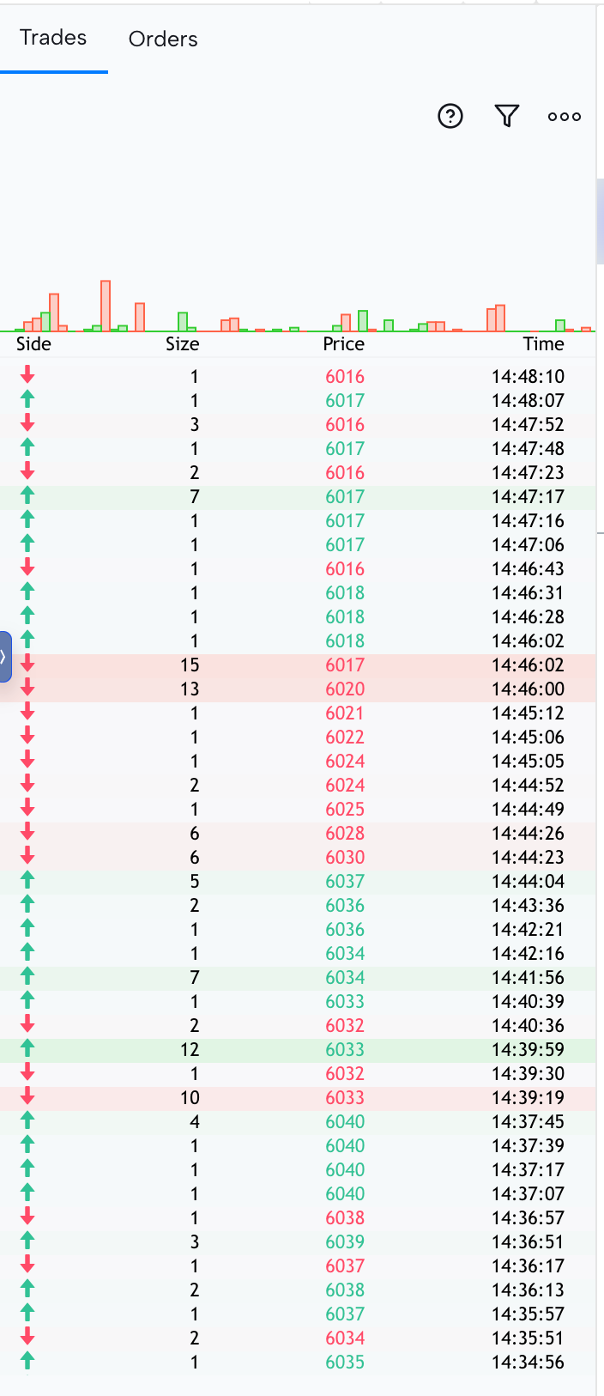
I’ve also attached a screenshot for reference (from the Gocharting view I’m trying to replicate).
Would appreciate any documentation, logic, or guidance you can share on how to calculate or interpret trade direction using your WebSocket data.
Thanks in advance!
Best regards,
Shashi
I understand this particular item is under consideration. However, is there any other option to identify confidently buy/sell trade and volume from the tick data?
I understand this particular item is under consideration. However, is there any other option to identify confidently buy/sell trade and volume from the tick data?
Hey Shashi,
I came across your TrueData forum post about deriving Buy/Sell side from the WebSocket feed, and it was very relevant for me.
I’m currently using GoCharting with a fairly heavy Lipi-based indicator for orderflow/alert generation, but honestly Lipi has become too slow and limiting for my setup. I’m now looking to move away from GoCharting completely and build a more direct algo trading setup using a tick-by-tick data feed.
Since you seem to be working on something very similar, I wanted to ask if you’d be open to sharing a bit about what all you’re getting from TrueData in practice.
A few things I’m specifically trying to understand:
I’m basically trying to switch from GoCharting and need enough raw data for my algo trading setup, so your experience would really help.
If you’re okay with it, could we connect directly as well? You can share your email, Telegram, or whichever is convenient.
Would really appreciate it.
Thanks!
Replies have been locked on this page!